
2023-2024 Winter Outlook
2023-2024 Winter Outlook
2023 - 2024 Winter Outlook

Current sea surface temperature anomalies with El Nino conditions (warmer-than-normal) in the tropical Pacific Ocean. Map courtesy Canadian Met Centre
Overview
A major change has come to the tropical Pacific Ocean since last winter with respect to sea surface temperatures and this transformation will have a big impact on the upcoming winter. Specifically, above-normal sea surface temperatures (El Nino) have replaced the cooler-than-normal conditions (La Nina) of the previous winter. In fact, the tropical Pacific Ocean uncommonly featured “back-to-back-to-back” La Nina winters with cooler-than-normal water temperatures, but drastic changes began to take shape earlier this year.
The return of El Nino to the tropical Pacific Ocean increases the chance for a “blockbuster” snowstorm (or two) in the eastern US which hasn’t happened in the DC-to-Philly-to-NYC corridor since January 2016 when up to two feet of snow fell near all the big cities along I-95. In an El Nino winter, the strongest part of the jet stream tends to shift southward and extends farther east across the Pacific Ocean. As a result, this southern or Pacific sub-tropical branch of the jet stream can steer storms into the southern and eastern US with enhanced moisture content.
The temperature pattern across the nation in an El Nino winter is largely influenced by the magnitude of the El Nino as well as its ultimate location in the equatorial Pacific (i.e., central, or east based). It appears to me this will be kind of hybrid El Nino in terms of its location with the warmest water “relative-to-normal” in eastern sections near the west coast of South America early on this winter season and then becoming focused over central sections of the tropical Pacific.

Normal Seasonal Snowfall for the Mid-Atlantic’s I-95 Corridor
Key Factors
There are several key factors listed below that were evaluated for the 2023-2024 “Winter Outlook”:
Moderate-to-Strong El Nino as we begin winter season and focused in eastern sections…weakens during second half and becomes more centered in central locations
Strengthening of the southern (Pacific sub-tropical) branch of the jet stream with enhanced moisture content
Increases the chance for a “blockbuster” coastal snowstorm (or two)
Overall favorable signals for cold air intrusions: “high-latitude blocking”; stratospheric warming/polar vortex disruption:
Recent trends in “Omega” blocking, AO, NAO teleconnection indices
Quasi-Biennial-Oscillation (QBO) in a “negative” (easterly) phase
“Siberian snowpack”
Analog years and their possible clues for the upcoming winter:
1957/1958, 1972-1973, 1997/1998, 2002/2003, 2009/2010, 2014/2015
El Nino Follows “Back-to-Back-to-Back” La Nina winter

A moderate-to-strong El Nino is likely in the tropical Pacific Ocean as we begin the winter season with weakening likely during the second half and this will play a vital role in weather across the nation. Strong El Nino events were taking place on average about once a decade in the latter part of last century (1972-1973, 1982-1983, 1997-1998); however, the first decade of this century did not feature a comparable strong El Nino. Instead, there were three moderate El Nino events in the following years (2002-2003, 2006-2007 and 2009-2010) and then a strong event did take place in 2015-2016.

La Nina (colder-than-normal) conditions ruled the tropical Pacific Ocean a year ago (top plot) whereas El Nino is in charge this year (bottom plot). Maps courtesy Canadian Met Centre
The longstanding La Nina in the equatorial Pacific began to transition to El Nino earlier this year and it strengthened considerably during the spring and summer months. A moderate-to-strong El Nino is likely to increase the intensity of the southern (Pacific sub-tropical) branch of the jet stream during the upcoming winter season and act to pump a lot of moisture into the overall upper-level wind flow. The southern branch of the jet stream can be crucial for the development of storm systems in the southern and eastern states adding to the potential for “Nor’Easters” in the Mid-Atlantic and Northeast US.

El Nino winters generally feature an active southern (Pacific sub-tropical) branch of the jet stream while La Nina winters often feature a more active northern (polar) branch. Graphic courtesy NOAA
While the magnitude of El Nino is very important as far as its potential impact on our winter weather, so is its location in the tropical Pacific Ocean. A “central-based” El Nino is one in which the greatest sea surface temperature anomalies are located in the central Pacific Ocean whereas an “eastern-based” El Nino has the warmest water relative-to-normal near the west coast of South America. A “central-based” El Nino is more likely to be associated with an upper-level ridge of high pressure along the west coast of North America and this, in turn, can help to push cold air masses into the eastern US. An “eastern-based” El Nino near the west coast of South America would more likely result in southwesterly winds across the eastern US producing warmer-than-normal conditions. I believe recent changes in the overall sea surface temperature pattern across the Pacific Ocean favor a kind of hybrid El Nino in terms of its location with the warmest water relative-to-normal near the west coast of South America early this winter (i.e., eastern-based) and then more central-based in the equatorial Pacific later in the winter.
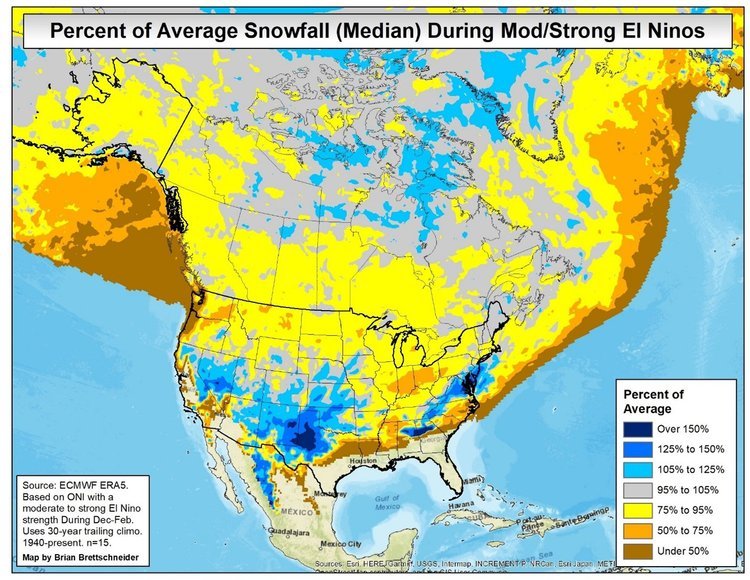
Moderate-to-Strong El Nino events in the past have produced blockbuster snowstorms - even if overall temperatures for the winter averaged above-normal. One such example of a major snowstorm that took place during a strong El Nino winter took place in February 1983. That winter season actually featured overall above-normal temperatures, but it still produced a blockbuster snowstorm during an Arctic air outbreak in February 1983. Map courtesy Brian Brettschneider, Twitter

NOAA/CFSv2 Sea Surface Temperature (SST) anomaly forecast as of October 15th for December-January-February; courtesy NOAA/NCEP/CP

JAMSTEC Sea Surface Temperature (SST) anomaly forecast December-January-February; courtesy Japan Agency for Marine-Earth Science and Technology (JAMSTEC)

Sea surface temperature “anomalies” (top) and “actual “(bottom) across the equatorial Pacific Ocean (as of October 10th, 2023).
Multiple computer forecast models feature a moderate-to-strong El Nino during the first part of the upcoming winter season with a tendency for it to weaken during the second half. Two independently-made sea surface temperature anomaly forecasts made for the upcoming winter season tend to agree with each other and other forecast models on the overall pattern across the tropical Pacific Ocean. NOAA’s CFSv2 suggests the El Nino conditions will be centered over both the central and eastern Pacific Ocean during the winter season of December, January and February. The JAMSTEC forecast model is produced by Japan’s Meteorological Agency and it tends to agree with the NOAA/CFSv2 winter forecast in the overall sea surface temperature pattern across the Pacific Ocean.
Assessing the Prospects for Cold Air Intrusions: “High-Latitude Blocking”; Stratospheric Warming/Polar Vortex Disruption

“Omega” blocking has persisted in the polar region during the summer season of 2023 and this is usually a favorable sign for continued blocking during the subsequent winter season. Map courtesy NOAA
In addition to the analysis of analog years and sea surface temperature anomalies, it is also important to evaluate the prospects for cold air intrusions from the northern latitudes into the middle latitudes. Some of the processes involved with transporting cold air masses from the northern latitudes to the middle latitudes include atmospheric phenomena known as “high latitude blocking”, stratospheric warming, and polar vortex disruption. Overall, I see generally favorable signs for each of these to occur this winter season leading to frequents cold air outbreaks into the central and eastern US.
1) Trends in “Omega” blocking, AO, NAO
“High-latitude blocking” is typically characterized by persistent high pressure in northern latitude areas such as Greenland and northern Canada. Without this type of upper-air pattern in the atmosphere, it would be quite difficult to get sustained cold air masses in, for example, the Mid-Atlantic region during the winter season; especially, during El Nino (warm) events. Coastal storms in the I-95 corridor absent sustained cold air would be much more likely to generate rain or snow changing to rain in the big cities along I-95.
One way to assess the likelihood for “high-latitude blocking” in the upcoming winter season is to monitor patterns during the preceding summer and fall seasons. In this past summer and during the fall so far, there has been much in the way of “Omega” blocking in the upper atmosphere with numerous highs and lows around the globe. This kind of pattern unusually results in slow movement of surface highs and lows and can lead to extended stretches of good or bad weather conditions. In fact, this “omega” blocking pattern has resulted in some extreme rain events in recent months where, for example, Greece and Libya suffered through excessive rain events as they were underneath slow-moving upper-level troughs of low pressure for extended periods of time. The recent history of frequent “high-latitude blocking” aloft is a moderately favorable sign for additional blocking events to occur during this upcoming winter season which, in turn, favors cold air intrusions into the eastern states.
Another way to assess the likelihood for “high-latitude blocking” is to monitor trends in teleconnection indices known as the Arctic Oscillation (AO) and its closely-related cousin called the North Atlantic Oscillation (NAO). The Arctic Oscillation refers to opposing atmospheric pressure patterns in middle and high latitudes. When the AO is positive, for example, surface pressure is low in the polar region and this helps the mid-latitude jet stream to blow strongly and consistently from west-to-east keeping Arctic air locked up in the polar region. When the AO index is negative, there tends to be high pressure in the polar regions (i.e., “high-latitude blocking”), weaker zonal winds, and greater movement of polar air into the middle latitudes. While the AO and NAO indices are primarily used during by forecasters during the winter season, trends in summer and fall seasons can provide important clues about the ensuing winter season.
Evidence shows that when AO and NAO values are largely negative in summer and fall, the subsequent winter season will typically have frequent “negative” AO and NAO periods which are correlated with “high-latitude blocking” patterns. As it turned out, the AO signal through the summer and fall has been rather neutral whereas the NAO has been often on the negative side. As a result, I would consider the combination of these two signals to be slightly favorable for “high latitude blocking” events to take place this winter season.


North Atlantic Oscillation index (actual values black; forecasted values red); Plot courtesy NOAA
2) Quasi-Biennial Oscillation (QBO)

Recent upper air observations suggest the Quasi-Biennial Oscillation (QBO) is headed for a “negative” (easterly) phase during the upcoming winter season.
An atmospheric phenomenon known as the “quasi-biennial oscillation” (QBO) is a changing wind anomaly in the tropical lower stratosphere. It has been found that strong stratospheric winds along an equatorial belt tend to completely change direction about every 14 months or so and this oscillation appears to play a crucial role in seasonal weather patterns as it can impact the polar vortex and the overall jet stream. Specifically, the tropical lower stratosphere winds flip from west-to-east or east-to-west every 14 months or so, an average period of about 28 months to return to the starting state. Currently, the QBO is in a west-to-east flow or what is known as a “negative” (easterly) phase. In fact, the QBO has been increasingly “negative” in recent months (-5.96 in July, -9.88 in August, -13.58 in September) as calculated by NOAA’s Physical Sciences Laboratory at the 30 millibar level over the equator. Recent upper air observations from NASA radiosondes suggest the “negative” QBO phase will likely dominate during this upcoming winter season and this is strongly suggestive of colder-than-normal weather in the eastern US.

Colder-than-normal conditions tend to dominate in the eastern US winters when QBO is in a strongly “negative” phase (-10 to -15). Map courtesy WXRisk.com, daculaweather.com
Effects of the QBO include mixing of stratospheric ozone by the secondary circulation caused by the QBO, modification of monsoonal precipitation, and an influence on stratospheric circulation in northern hemisphere winters (i.e., an impact on the frequency of sudden stratospheric warming (SSW) events and the disruption of the polar vortex). The QBO’s exact influence depends on outside forcing, such as El Nino Southern Oscillation (ENSO). In other words, an east or “negative” QBO will impact the Polar Vortex differently depending on the ENSO state: El Nino or La Nina.
During an easterly or “negative” phase of the QBO in an El Nino winter, there is a tendency for an increase in Sudden Stratospheric Warming (SSW) events and the disruption of the polar vortex, a weaker Atlantic jet stream, and cold winters in northern Europe and the eastern US whereas westward or “positive” phases of the QBO often coincide with mild winters in northern Europe and the eastern US. Stratospheric warming events and the disruption of the polar vortex in the northern hemisphere winter typically increase the chance for Arctic air outbreaks to reach the lower latitudes from the higher latitudes.
3) The “Siberian Snowpack” Signal
In addition to the recent trends in “Omega” blocking and teleconnection indices such as the AO and NAO, snowpack in the northern hemisphere during the autumn season has also been found to be an important predictive factor with respect to “high-latitude blocking” patterns during subsequent winter seasons. In fact, research studies have suggested that the change in snowpack across Siberia during October is critical with respect to the likelihood of “high-latitude blocking” atmospheric patterns during the following winter season. Specifically, if snowpack is above-normal and consistently expanding during October in the Siberian region below 60 degrees (N), studies have shown there is an increased chance for more frequent “high-latitude blocking” configurations in subsequent winter months. There has been a notable increase in snowpack across Siberia during the first half of October to the north of the 60 degree (N) latitude; however, somewhat less to the south of there. All in all, I would call this “Siberian snowpack” signal “neutral” to slightly “negative” in terms of it being supportive of “high-latitude blocking” events.


Expansion of Siberian snow cover during the month of October has been found to be correlated to “high-latitude blocking” events during the subsequent winter season. Snow cover (shown in white) in Siberia has increased markedly between late September (top) and mid-October (bottom) in areas to the north of 60 degrees (N) latitude, but somewhat less to the south of there. Maps courtesy NOAA
Analog years
While sea surface temperatures never repeat exactly from one year to another, it is still quite useful for long-range forecasting purposes to find “analog years” in which there are somewhat similar oceanic patterns to current conditions. Indeed, I believe the following winter seasons featured somewhat analogous sea surface temperature patterns compared to today’s environment and they can provide us a clue as to what type of winter we may experience: 1957/1958, 1972-1973 (east-based El Nino), 1997/1998 (east-based El Nino), 2002/2003, 2009/2010, and 2014/2015. The one overriding characteristic of these analog years that I chose is that they all were transition years leading up to a given winter season with longstanding La Nina conditions changing to El Nino. In addition, as I believe this will kind of a hybrid type of El Nino – i.e., east-based early, central based later – I purposely chose analog years that included both of these scenarios. The six analog winter seasons resulted in overall temperatures that averaged below-normal across much of the southern and eastern states including the Mid-Atlantic region.

Average December-to-February temperature anomaly pattern for my analog years; Map courtesy NOAA

Average December-to-February precipitation anomaly pattern for the analog years; Map courtesy NOAA
As far as precipitation is concerned, these six analog years featured wetter-than-normal conditions on average in parts of the southern and eastern US as is somewhat typical during El Nino winters and is reflective of the “pumped up” southern branch of the jet stream. In addition, much of California experienced above-normal precipitation amounts in these chosen analog years.
The Bottom-Line
Given the expected oceanic surface temperature patterns around the world for this upcoming winter season and the overall generally favorable prospects for cold air intrusions into the US through such atmospheric phenomena as “high-latitude blocking”, stratospheric warming, and polar vortex disruption, I believe much of the eastern and southern US will experience colder-than-normal temperatures this winter season. In the Mid-Atlantic region from DC-to-Philly-to-New York City, overall winter temperatures can average 0.5°C to 1.5°C below-normal and this winter should include occasional significant and sustained Arctic air outbreaks.
The overall weather pattern should lead to an active southern branch of the jet stream and an increased chance for east coast storms that, in turn, leads to an increased chance for a blockbuster snowstorm (or two) in the I-95 corridor. As a consequence, above-normal snowfall is expected in DC, Philly and New York City and accumulating snow can begin early in the season…look for at least 20-30 inches in the DC metro region, 30-40 inches in Philly, and 35-45 inches in the NYC metro region.
Elsewhere, the region from the Northern Plains to the Pacific Northwest should feature above-normal temperatures which will be quite different than most recent winters. Precipitation should be above-normal in California and higher-than-normal across much of the southern US as well as up along the eastern seaboard.